Proving Capital Efficiency (Part 1)
The first MACRO Score Capital Efficiency simulation, looking at Aave V2 Ethereum borrowers. High MACRO Score users had lower liquidation rates, repaid more often, and had healthier accounts.

A Simulation of MACRO Scores on an On-chain Protocol
We are running a series of capital efficiency simulations to test our MACRO Scores against real-world data. This one, our first, looks at Aave V2 Ethereum borrowers and finds higher scores correlate with lower liquidation rates and excess collateral.
Margarita Kirakosyan
One of the questions Spectral users ask us is whether or not our on-chain creditworthiness assessment MACRO Scores are capable of adding significant value to their protocols (and if so, how much?). Our hypothesis is that MACRO Scores can improve capital efficiency by allowing a protocol to segment its users into different categories of risk, i.e. users with higher MACRO Scores, signaling a much lower risk of liquidation, could be offered different terms than higher-risk users.
For the past three months, we’ve been running a variety of capital efficiency simulations to test our hypothesis. This article will cover our first simulation, which used data from Aave V2 Ethereum borrowers to (1) validate whether differing groups of MACRO Scorers would perform as expected and (2) estimate how much low-risk borrowers would benefit given better collateral requirements. Subsequent simulations will look at optimal risk parameters (such as collateral requirements, borrow interest rates, reserve factors, etc.), and apply MACRO Scores to lending club data to compare them to traditional creditworthiness assessment.
With respect to borrowing on Aave V2, we found that MACRO Scores were an accurate measure of liquidation risk. High MACRO Scores users were liquidated less often than lower scoring users, were better at repayment, and kept healthier account balances. By giving them better terms, Aave borrowers could have enjoyed significantly better capital efficiency during the year we modeled.
What is the On-chain MACRO Score?
The MACRO Score is web3’s premiere creditworthiness assessment tool. It considers a wallet’s lending and borrowing behavior, along with over a hundred other features to generate a human-readable score of between 300-850, assessing the likelihood of liquidation.
A Deeper look at the MACRO Score discusses how the Score was created, its features, and its accuracy metrics. The higher the MACRO Score, the lower the risk of liquidation.
Methodology
We collected all Aave V2 Ethereum platform users who had a borrowing history as of December 1st, 2021 (a total of 19,656 wallets) and generated MACRO Scores for that date. We bucketed these users by MACRO Score and analyzed what happened to those users during the following year (between December 1st, 2021, and December 1st, 2022).
Results and Observations
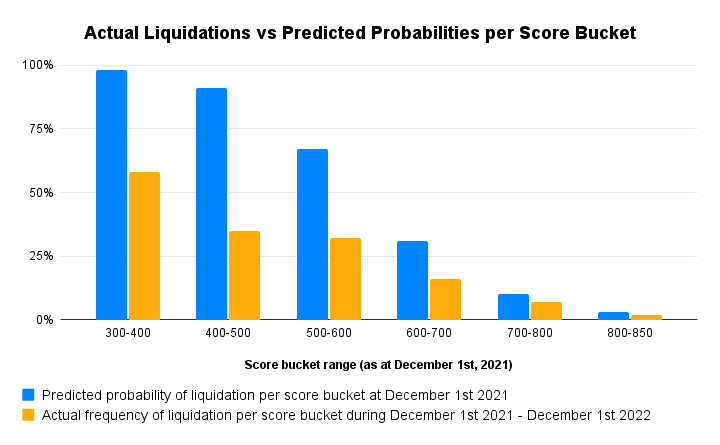
The MACRO Score predicts liquidation risk accurately. Even though the underlying machine learning model of the MACRO score was trained to predict liquidations within 60 days, it performed well at predicting liquidations over the span of an entire year.
For Aave V2 borrowers between December 1st, 2021, and December 1st, 2022, we predicted that 3 percent of users with exceptional creditworthiness (MACRO Scores of 800-850) would be liquidated that year. Back-testing the data revealed only 2 percent liquidation that year.
For borrowers with excellent creditworthiness (MACRO Scores of 700-800), we predicted 10 percent liquidation per Score and observed 7 percent.
For borrowers with good creditworthiness (MACRO Scores of 600-700), we predicted 31 percent of borrowers would be liquidated and observed 16% liquidation that year.
From the graph above, we can see that the actual frequencies of liquidation per score bucket are aligned with the initial predicted probabilities of liquidation. These are less than the predicted probabilities. The predicted probabilities of liquidation in turn are a bit more conservative and were projected to take into account greater market volatility than actual market conditions observed.
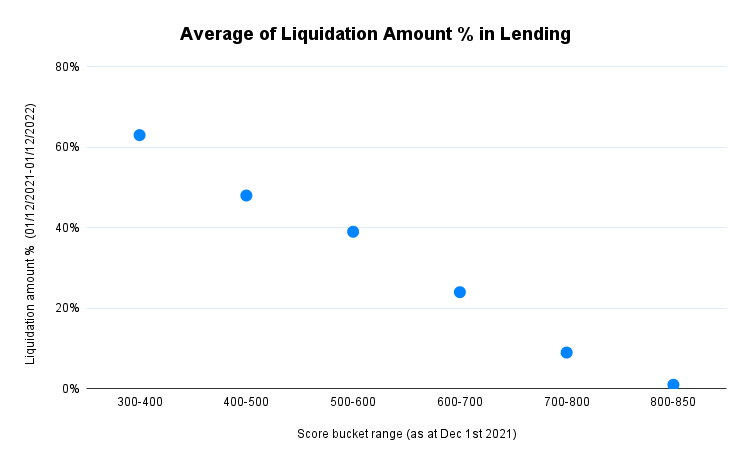
On average the higher scoring group users not only were liquidated less often, but in the case of liquidation, the average percentage of liquidation amount in collateral during the year was smaller than it was with lower scoring users. Thus MACRO Scores not only reflect the probability of liquidation but also the liquidation amount vs. collateral percentages.
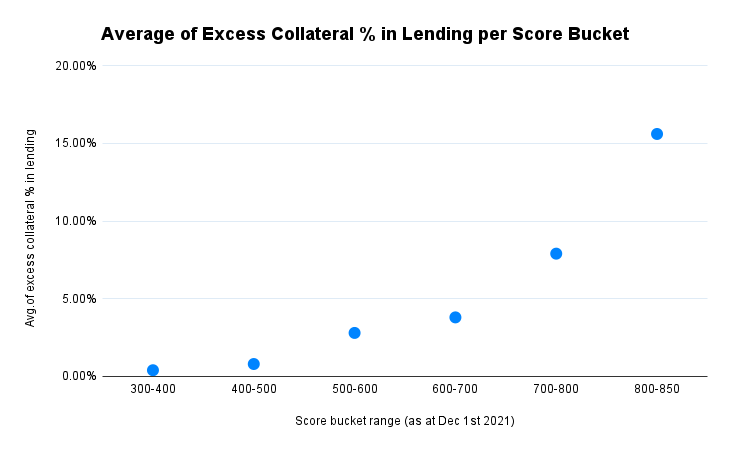
And by average excess collateral amount:
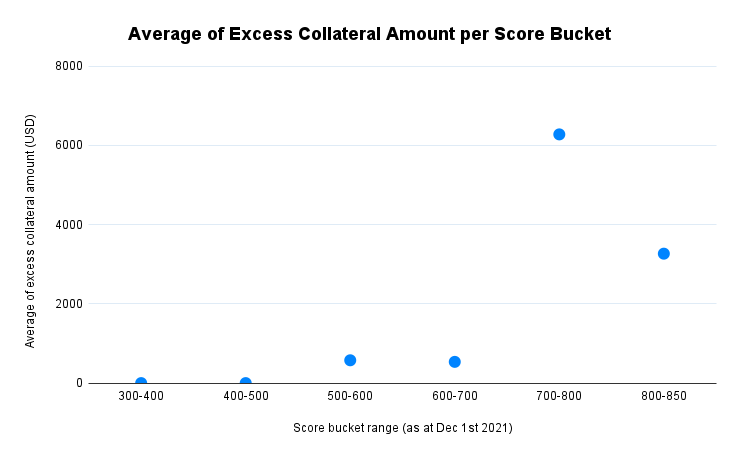
The graphs above show how much excess collateral could be unlocked for relatively high-score group users. Here we define excess collateral percentage in lending as the percentage of a deposit that could be used as collateral (or alternatively the % of a deposit that could be used as available collateral for making other borrows).
Above a MACRO Score of 500-600, users could have held less collateral or, alternatively, could have borrowed more. (NB: Instead of actual Loan to Values (LTV) and liquidation threshold (collateral factors) values per token were applied so that their respective values equaled 100%.).

Other Notes and Observations
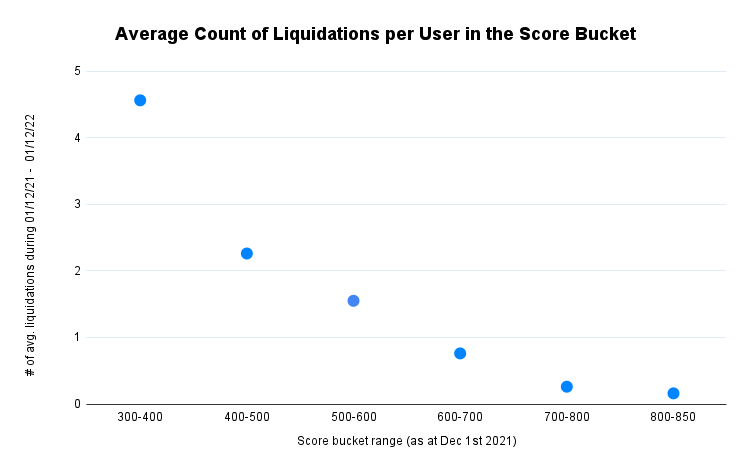
The high-risk users on average were liquidated more often than low-risk users.
And by liquidation amount:
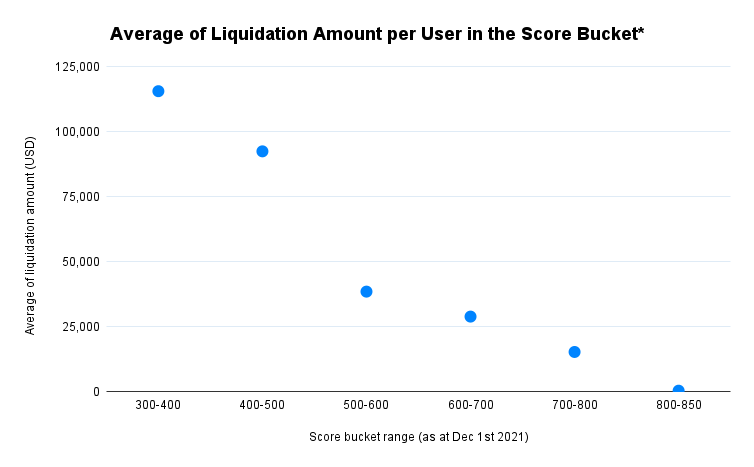
* Excluding outlier liquidations with > $20m USD amount
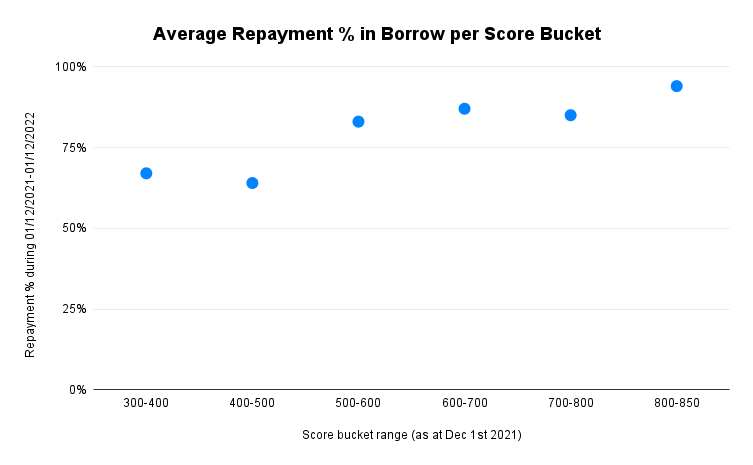
The higher the MACRO Score, on average, the better the repayment history. Low-risk users were also liquidated on average for less than high-risk users.
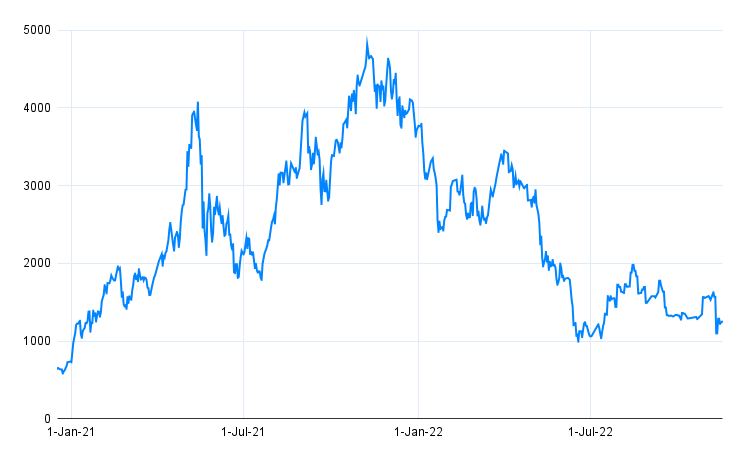
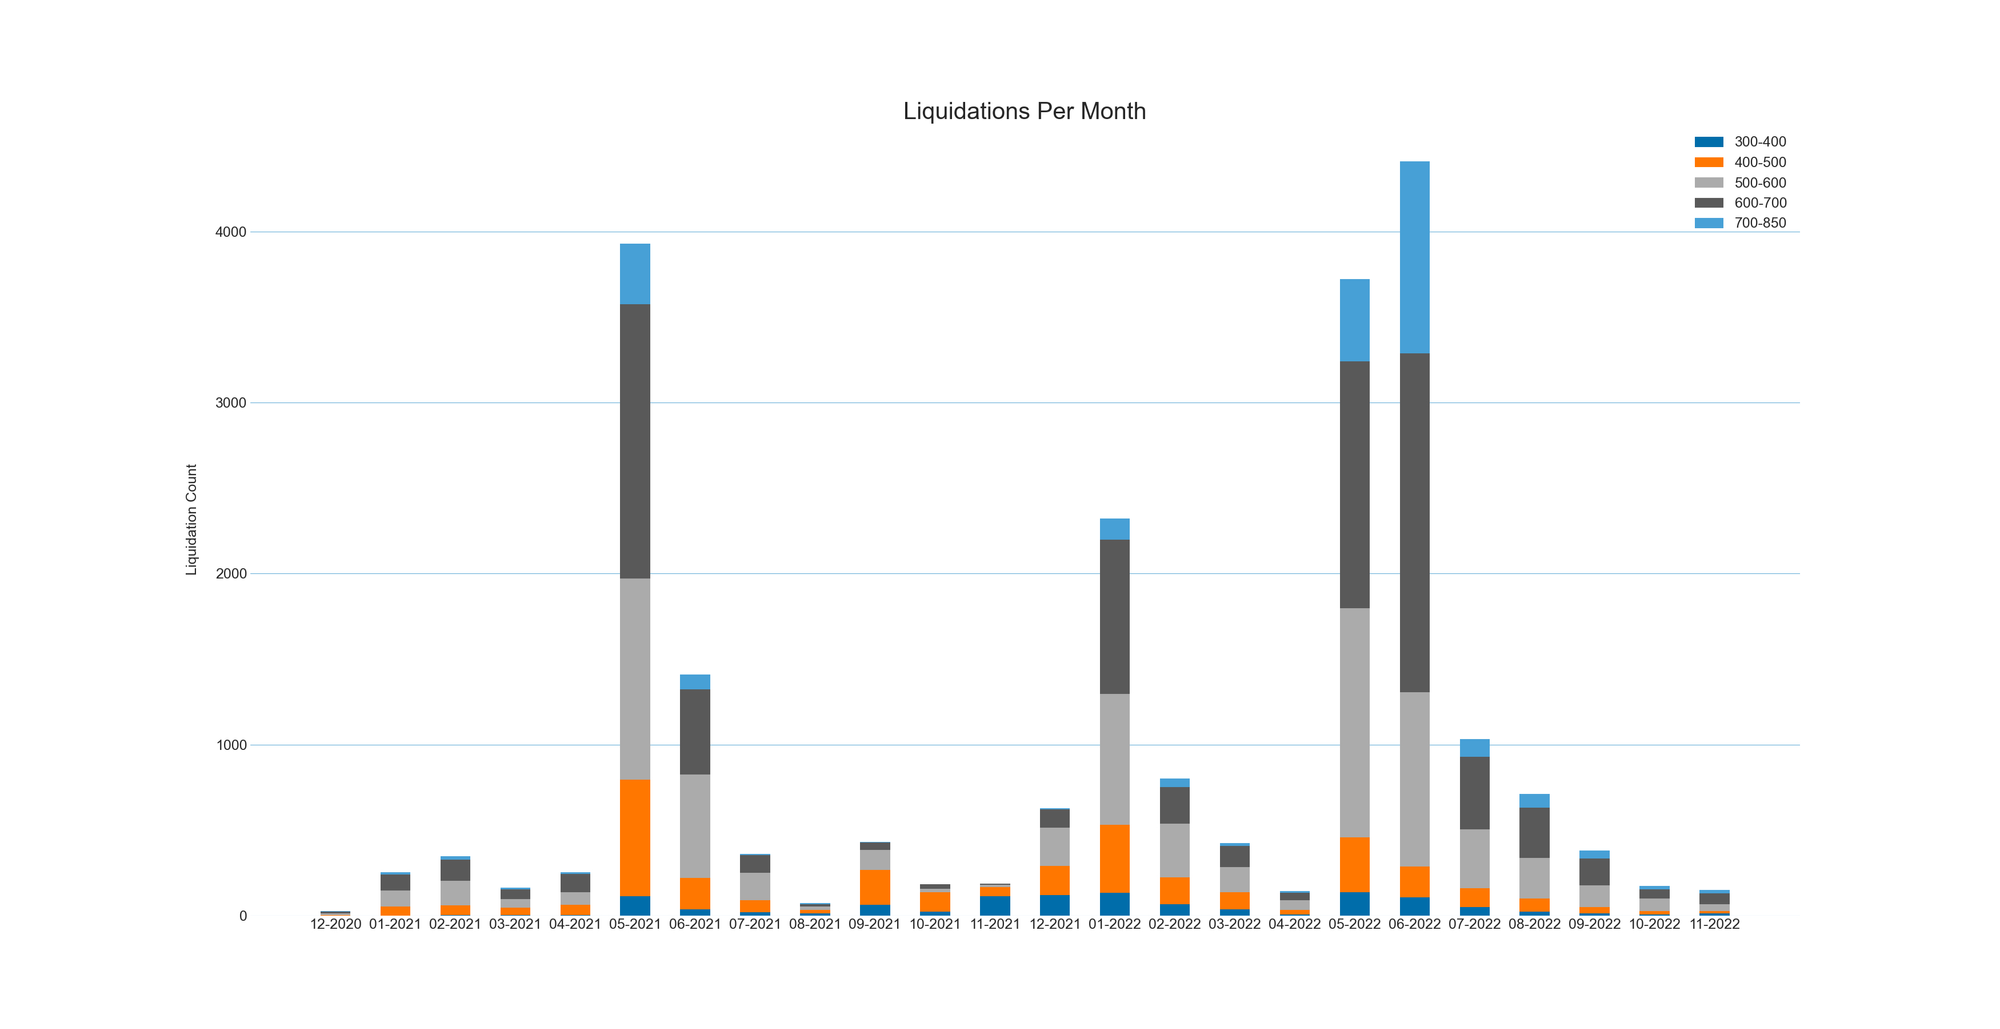
Liquidation event analysis shows low-risk users were more often liquidated during extreme market conditions, i.e. liquidation events were less dispersed than for lower score bucket users.
Ethereum Price by Date:
And liquidation count by score by month:
Considering the average of Minimum Health Factor per User in Score Bucket
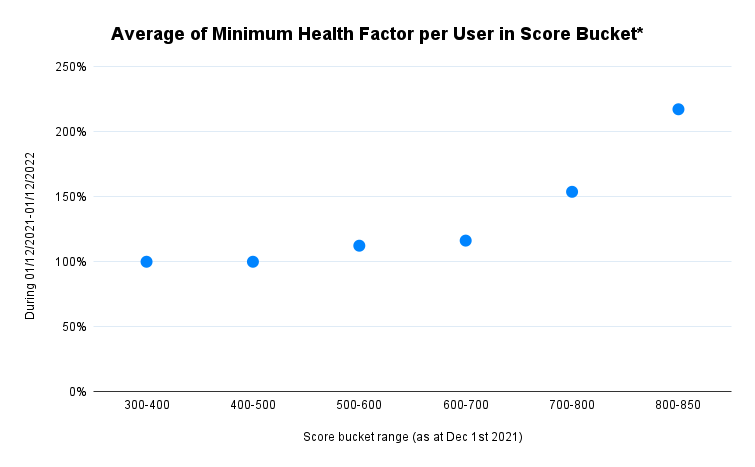
* Health factors are capped by a lower 100% threshold
High-score users tended to hold a healthier collateral balance in their accounts. Their health factors were also better, and they had fewer days when they teetered at the brink of liquidation. Fewer high-score users were insolvent (i.e. their total borrow value > than the total collateral value) without liquidation during the year under observation.
The analysis suggests that:
- High-score users might benefit by depositing less collateral or borrowing more in case of being offered better collateral requirements.
- The MACRO scores might be also useful when there are being made projections of future cash flows for segmented user groups (repayments, liquidation amounts, etc.).
Definitions for the Spreadsheet:
- The predicted probability of liquidation refers to the probability of a liquidation event after scoring the user.
- The borrow percentage is the borrow-balance percentage in lending balance during the year
- The excess collateral percentage in lending is the percentage of a deposit that could be used as collateral (or alternatively the % of a deposit that could be used as available collateral for making other borrows).
- Excess collateral amount refers to the same values as above but in USD.
- Liquidation event count is the number of liquidations during the year.
- The actual frequency of liquidation per score bucket group refers to the percentage of users who were liquidated during the year
- The liquidation amount is the amount of liquidation in the event of liquidation
- Liquidation amount percentage in lending refers to the maximum liquidation amount percentage in a lending balance during the year observed.
- Minimum health factors are the minimum health factors during the year capped by the lower 100% threshold
- The number of days the user was close to liquidation counts the number of days a user was within 10% of being liquidated.
- Repayment percentage in borrow refers to the total repayment percentage in total borrows during the year.
- Insolvent users count percentage in a MACRO Score bucket group are the cases when users’ health factors passed a liquidation threshold, but the liquidation event did not occur (which led to bad debt cases).

How We Use Spectral Wallet Signals to Analyze Data
The MACRO Score is intended to estimate the probability of liquidation within 60 days, far less than the year observed by this simulation. The strength of its predictive ability comes from our predictive model’s 138 constituent features, which we refer to as our Wallet Signals.
The granular detail provided by the model, not to mention the pool of on-chain data we pull from, gives us fodder for deep and insightful analysis. Wallet Signals are available from our API, for a free trial period or at scale.